GPU Overview
GPU Overview
#380640
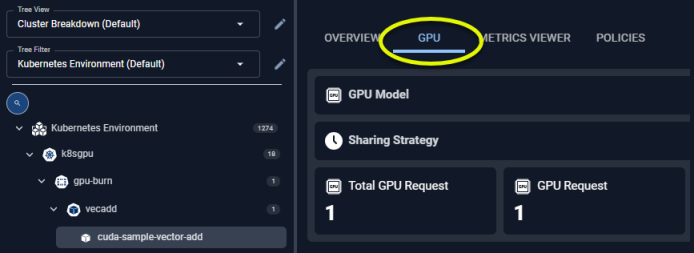
The cards on this tab provide a visual overview of a single container's GPU allocation and utilization details. When navigating the tree viewer, you will see this tab when a single item, with allocated GPU resources, is selected.
You will see the Summary Tab when more than one container is selected.
Figure: Locating the GPU Tab
GPU Summary
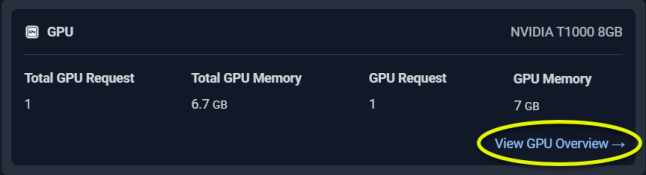
This card summarizes the GPU allocation and for the selected container. This card is only displayed if the GPU resources have been allocated to this container. A hyperlink at the bottom of the card takes you to the GPU page.
Figure: GPU Summary
Utilization Charts
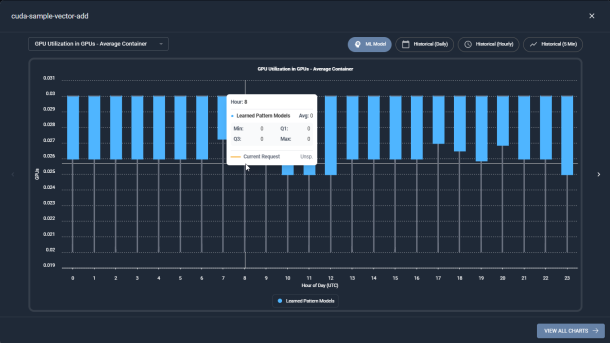
The last section provides utilization charts that show hourly min/max and sustained activity for the selected container. See AI Analysis Details Utilization Charts for details on using these charts to review workload data.
Figure: GPU Utilization Chart - Modal View
|
|
All other metrics are available on the Metrics Viewer Tab tab. You can also expand any chart to the modal view and adjust the timeline and the type of data to view ML model for the last day or historical data.
A link at the bottom of the modal page takes you to the Overview Tab tab for the selected instance.